Spectroscopic Ellipsometry
ELLIPSOMETRY
Ellipsometry is a very sensitive measurement technique that uses polarized light to characterize thin films, surfaces, and material
microstructure. The main advantages of ellipsometry are
its non destructive character, its high sensitivity related to the measurement of the phase of the reflected light, its wide measurement
range (from fractions of single layers to micrometers),
and the possibility to control in real time complex processes. On the contrary, the main bottlenecks are the very complex analysis and
the costs of ellipsometric setups which are
commonly rather high.
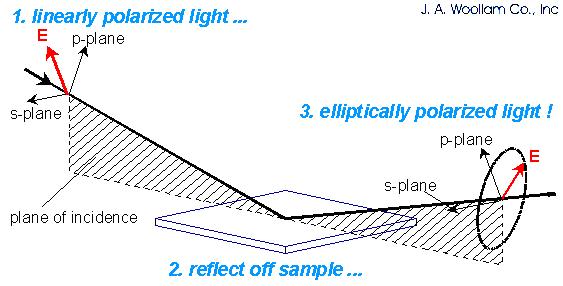
Geometry of an ellipsometric measurement
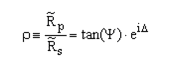
If a linearly polarized light of a known orientation is reflected at oblique incidence by a surface, the reflected light is elliptically polarized as schematically shown above. The shape and orientation of the ellipse depend on the angle of incidence, the direction of polarization of the incident light, and the reflection properties of the surface. Ellipsometry measures two values, Psi (Y) and Delta (D), that describe this polarization change. These values are related to the ratio of Fresnel reflection coefficients, and for p- and s-polarized light, respectively by the following equation:
Since ellipsometry measures the ratio of two values, it can be highly accurate and very reproducible. In general the ratio is a complex
number, thus it contains phase information
(D) which makes the measurement very sensitive. The phase information increases the sensitivity to the surface
condition to a great extent, allowing the study
of ultra-thin films even at a sub-monolayer level.
All ellipsometer setups are composed by a light source and a detector. The arrangement of the optical components between the source and
detector defines the type of the specific
ellipsometer. Ellipsometers utilize two polarizers, one placed before the sample and the other (often called analyzer) placed just
prior to the detector. Some ellipsometer
arrangements use also a modulator (or compensator) placed between polarizer and sample.
Among the different ellipsometer arrangements, the most used are: null ellipsometer, polarization modulation ellipsometer, rotating
polarizer/analyzer ellipsometer.
Historically, the first ellipsometers were null ellipsometers; this configuration operates by adjusting the orientation of the polarizer,
compensator, and analyzer so that the light incident on the detector is extinguished or "nulled". In the polarization modulation
ellipsometers, a time dependent retarder (modulator) runs at very high speed allowing for very fast acquisition. Finally, the rotating
polarizer/analyzer ellipsometer works without retarder with continuously rotating polarizer or analyzer.
In the last years, the development of setups combining the possibility to perform measurement at variable angle of incidence and at
different wavelengths (Spectroscopic Ellipsometry ) have greatly increased the usefulness of ellipsometry.
In particular, spectroscopic measurements provide many information about the sample and also provide the ability to acquire
data in spectral regions where the measured data are most sensitive to the model parameters which are to be determined.
In spite of its extremely sensitivity, ellipsometry has not been widely used in the past because it is an indirect measurement requiring
the computational power of modern computers.
Ellipsometry does not measure directly the optical constants or film thickness, but Y and
D, which, however, are functions of these
characteristics. Film thickness and all optical constants must be extracted through a careful and rather sophisticated analysis based on
different models.
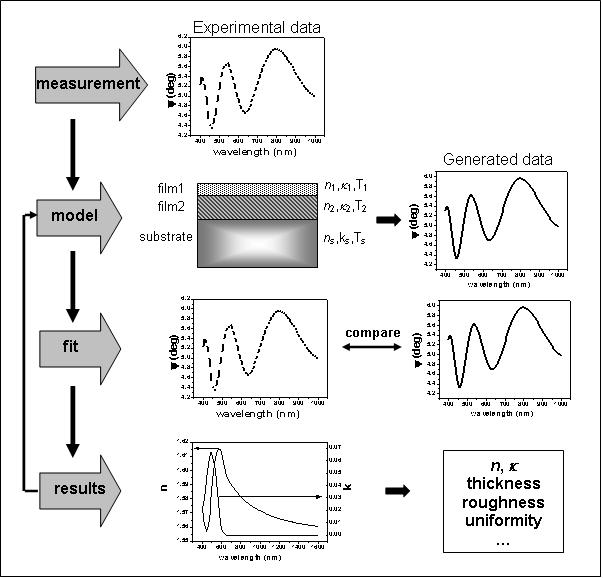
The modeling process is illustrated below. After measurement, the first step in data analysis is to build a model of the material. This
model needs to include the order of the layers, their optical constants and their thickness. If these values are not known, a
"best guess" should be entered. Next, data must be generated from the model and then compared to the experimental data.
If the starting values of the unknown parameters are too far off, the regression algorithm will get lost and we have
to restart from the model step changing fit parameter values or building a new model. Standard softwares for data analysis are based on
the mean squared error (MSE) to quantify the difference between experimental and calculated model data: a smaller MSE implies a
better fit. Levenberg-Marquardt algorithms are commonly used to quickly minimize the MSE value.
In our laboratory a spectroscopic ellipsometer VASE® produced by J.A. Woollam Co is available; the VASE® is a Variable Angle Spectroscopic
Ellipsometer which exploits the rotating analyzer configuration. The setup is equipped with a computer-controlled retarder
(AutoRetarderTM) which allows measurement of D in the whole range 0-360 without ambiguity; the measurable
spectral range is 190-1700 nm.
The modeling process for data analysis of ellipsometric measurements